

Using StatsSA data to create population data as Settlement footprint mesozone level
The intention is not to use this information as an indication of the number of people per settlement, but to reflect settlement growth focussing particularly on residential structures. Commercial and industrial structures have also been extracted and a similar process applied to determine where (their) growth has taken place. The following map illustrate the total number of residential structures related to the settlement footprint layer. One of the items of evidence support to the MCPP project represent settlement footprints that contain population data. To create this dataset the CSIR used the newly created settlement footprint mesozone layer (SF-MZ) – see the preceding item. The source for the population information is Statistics South Africa’s midyear estimatesThe settlement footprint mesozone layer was created to represent the spatial extent of settlement built-up footprints and the socio-economic descriptive information for these units need to be derived from other data sources. In this instance the up to date population data was only available at a local municipal level. As was discussed in the previous section, the building-based land use (BBLU) data is an appropriate ancillary dataset that represents the underlaying statistical service relating to the population distribution. Using a hybrid method based on the principles of dasymetric mapping and areal interpolation the BBLU was used to create a synthetic population at building level from the municipal macro totals and aggregating it again based on the footprint-meso layer.
Process used to populate the Settlement footprint mesozone layer
Data that represent residential structures is a good indicator of where people reside. In the South African context there are only two data sources that indicate this spatially namely the Dwelling Frame; the Dwelling Frame is a spatially referenced framework of structures within South Africa currently maintained by Statistics South Africa. The primary function of the Dwelling Frame is to provide a base for statistical sampling frames required for surveys and censuses by primarily StatsSA.The other dataset established and similar to the dwelling frame is the GeoTerra Image Building based land use data. It is an inventory of all building structures in South Africa, with associated land use classification scheme. This information is regularly updated with the addition and classification of new buildings. The BBLU data represent structures and cannot be directly related to population numbers by for instance using an average household size and then coming up with a population size. This is due to the reality that not all structures are necessarily occupied, or that that a general population size can be assigned to all residential building structures. Steps describe the process followed:
- Step 1 – The 2011 population (based on the census distribution) was already available and linked to the Settlement Footprint Mesozone. This addressed the challenge of changes to the municipal demarcations and ensures that population is reflected against the latest demarcation. It also ensures that later comparisons between different periods can be made.
- Step 2 – Residential points are extracted from the BBLU data for both 2011 and 2011.
- Step 3 – the 2011 household size is used and linked to the BBLU (it will represent number of people per point)
- Step 4 – Use the change in 2011 – 2021 to identify growth (or decline) areas
- Step 5 – The 2011 household size is linked to the BBLU now reflecting growth areas – this provides the relative contribution per point to the municipality
- Step 6 – The relative contribution of growth per point is multiplied with the population growth (LM level)
- Step 7 – The results (still linked to points) are spatially joined to the SFMZ and summerised to reflect the population per Settlement Footprint Mesozone unit.
In summary, using the BBLU data this municipal total could be processed and assigned, as explained in the above, to the settlement footprint areas within a municipality based on the residential structures present at a time.
The population was calculated per point and the points values linked to each settlement footprint. Based on the unique footprint identifier the population could be calculated for each settlement footprint mesozone. When the overall values are summarised, it would again represent the original StatisticsSA municipal ‘control’ totals.
Mapping results
Once the population information was reflected per SF-MZ it could be mapped to illustrate the numbers per footprint or change between periods. The following provides an example of the Settlement footprint layer with population change data (2011-2020) determined through the allocation process mentioned earlier. Because the data is related to the settlement polygon features the numbers are also linked to attribute table of the spatial layer the table can be extracted as a separate item if for example the list of settlement with their population needs to be used.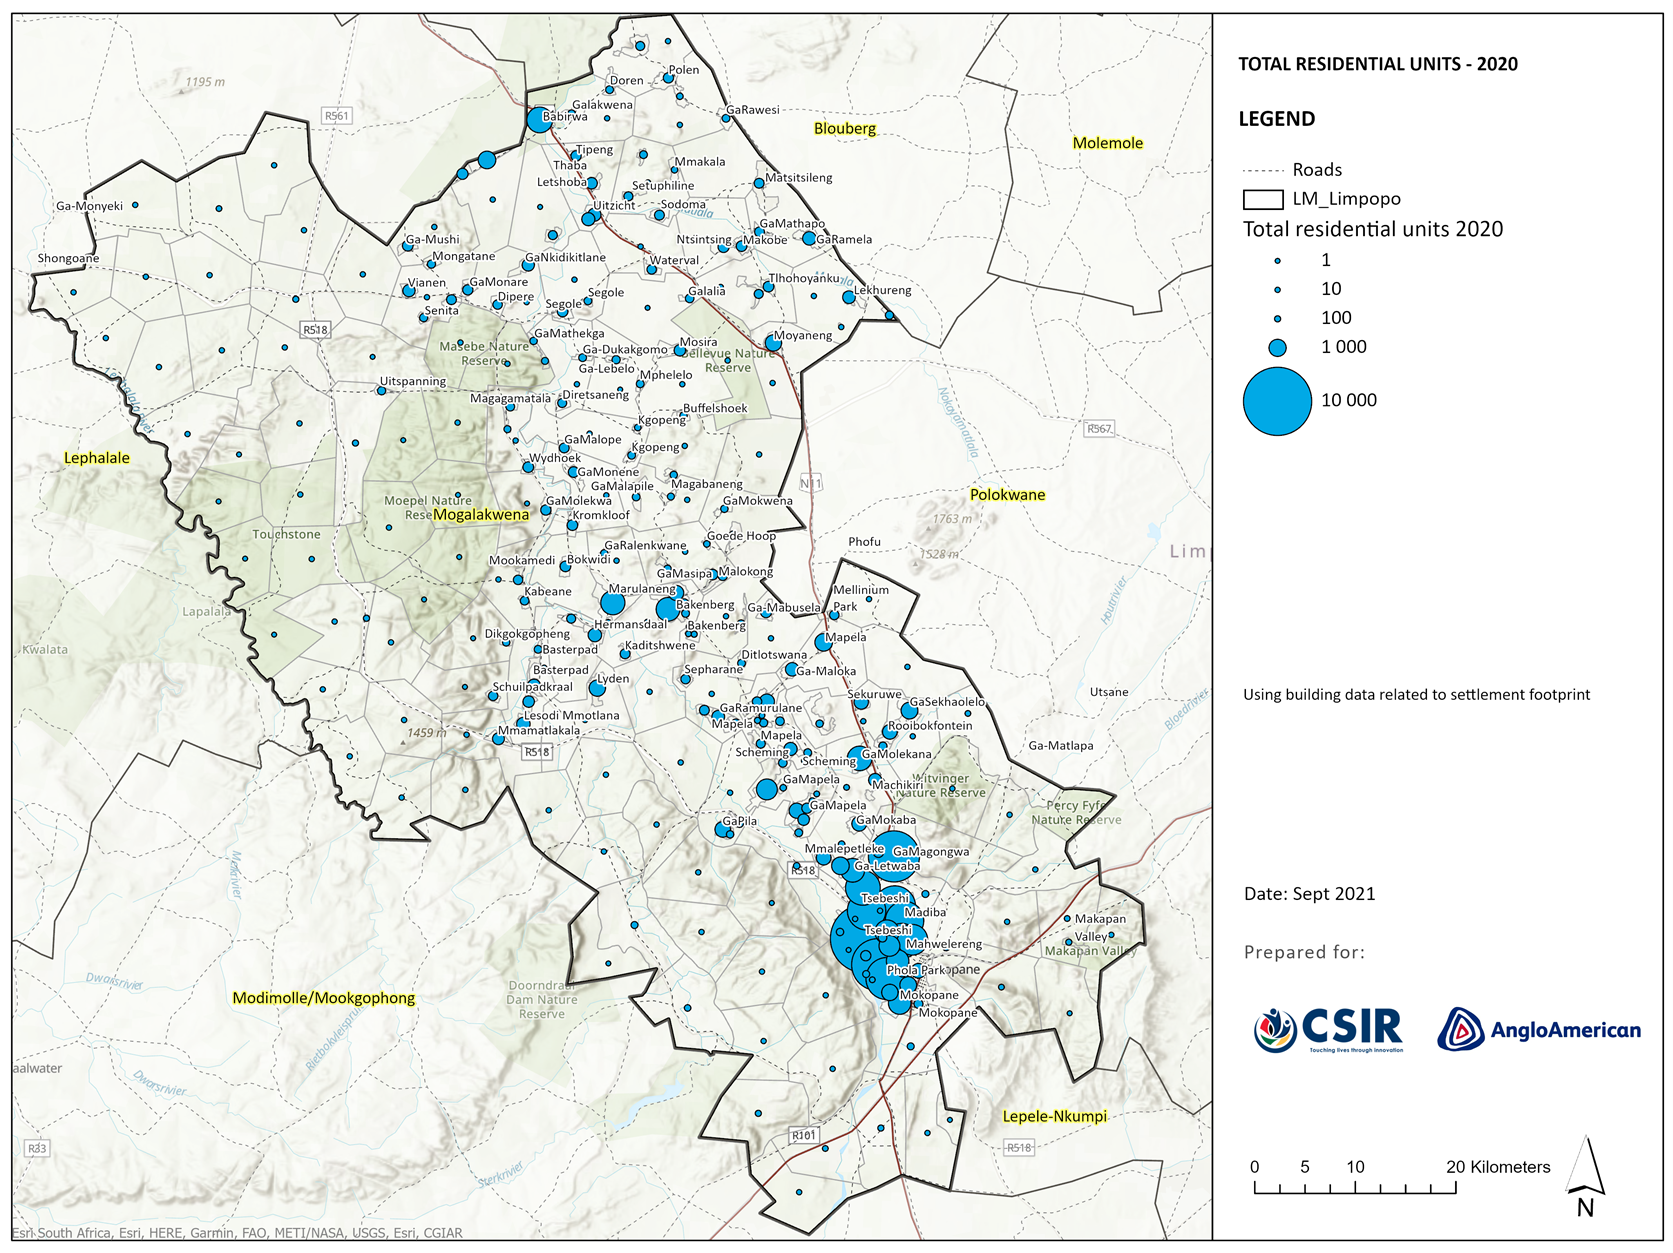
Population data reflected at the Settlement footprint mezosone layer
[1] This data was provided by Chantal Munthree (ChantalMu@statssa.gov.za) in August 2021