


New Settlement footprint data layer
Settlements, the spaces where human habitation occurs is at the heart of efforts to develop people’s lives. It is often associated with the clustering of people for cultural-, economic reasons or to gain access to services. Settlements differ in scale and complexity from the smallest hamlet to large urban areas. Settlements cannot be viewed on their own, but they also form part of the larger environment. Settlements often consume services such as water and electricity (where provided) or as users of services from their environment. In more traditional settings settlements can also use resources in their environment for agricultural purposes. Settlements are often at the core of planning activities and for effective and appropriate spatial planning, planners and decisionmakers require an accurate mapping and sufficient detailing of the settlements in their region. Settlements are also not static but can grow or even decline requiring that the infrastructure or services required also be adapted to changing realities.Demarcating settlements spatially has changed over time. Initially part of products developed by Surveys and Mapping (featuring in cadastral maps) and later part of the statistical units developed for enumerator purposes by Statistics South Africa represented settlements. Settlements were not always depicted as exact spatial features – the CSIR’s Mesozone framework could not always reflect only
settlement areas due to the size limitations
The origins of the footprint layer lie in the Enumerator area and Sub-place features of Statistics SA. These features do not in all cases only reflect the extent of settlements and can also include adjacent
non-settlement area types
The Settlement system comprise of a tiered system and the units are presented at its most detail spatial level (see Figure 1). The lowest level (T3) represents suburb type differentiation where EAs were grouped according to the StatsSA
sub-places it belongs to for continues areas
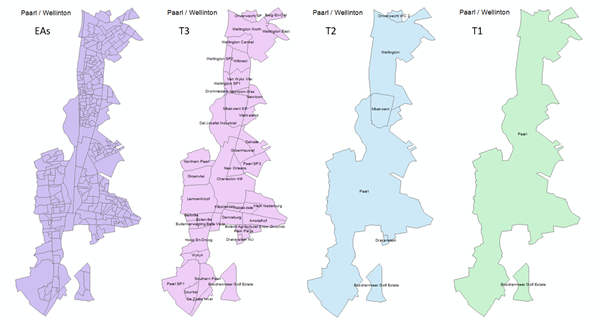
The settlements of Paarl- Wellington that originally comprise of many parts become more grouped into the main settlement. This includes portions of settlement located adjacent and in proximity that is in fact seen as part of the larger settlement/town. Where administrative boundaries such as local municipal boundaries cross such settlements, the settlements are cut according to this boundary line. This is done to ensure information for a municipality is related to the municipality. Additionally, when information is summarised it can be done to local municipal or higher level.
The CSIR has developed its own settlement typology over several years to differentiate settlements more widely, and to move away from an overly simplistic Urban-Rural categorization. In previous years the settlement typology was mainly related to the mesozone framework. While useful at a regional scale, it did present problems when wanting to look at settlements at a more local scale. The CSIR’s settlement typology has also evolved as additional work has been undertaken though consecutive projects. This typology has also been widely used in several spatial frameworks and as a medium to generate settlement profiles. The same typology is also applied to the new settlement footprint layer. Over time improvements will be made as areas adjacent to settlements will be reclassified when not representing a settlement.
What about the areas in-between settlements?
Although the use of settlement footprints makes the allocation of information for settlements more accurate, when looking at a region the areas in-between settlements also need to be represented. Although several options were considered, it was decided to utilize the mesozones framework. To achieve this the settlement footprint and the mesozone datasets were combined. Generally, the settlement footprint demarcation aligns (nests) well with the mesozones. Mesozones also has the advantage of already taking hard topographical boundaries (like rivers and mountain ridges) and administrative boundaries into account which becomes important when aggregating information to; or representing information at the local municipal level. Combining the two layers also improved the alignment of the mesozones within urban spaces.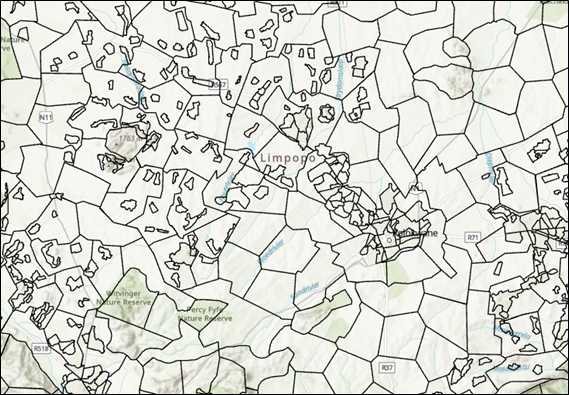
When only the mesozone data is required, the features can be dissolved based on the linked Mesozone code.
What is the value of the footprint-meso layer?
In the last few years there has been an increasing need to better reflect settlements within spatial data. The new layer provides a spatial framework that enables settlement specific information to be made available. It also raises the issue of ‘settlements’, their roles, types and specifies them in relation to a wider region. This settlement-meso layer can be described as living-layer as work will continue to improve resulting in the more accurate depiction of settlements and settlement boundaries change constantly.Data assigned to the footprint-meso layer
Data from various sources with differening spatial units of analysis and at different spatial resolutions are used to assign for instance population or economic variables to the footprint-meso layer. To translate the data from one spatial unit to another, a process based on the principles of dasymetric mapping is used. Dasymetric mapping is when an ancillary layer that represents the underlying statistical service of the aggregate origin dataset is used to get a higher resolution representation (Eicher & Brewer 2001). This ancillary data is then used to transfer the data values from one spatial unit of analysis to another, or then in this instance, from a particular source to the footprint-meso layer. The accuracy of the depiction of the data relies on the quality of the ancillary data used to predict the variation in the spatial distribution of the variable in question. Another consideration is also that the ancillary data used must be updated regularly (at least yearly) to ensure consistency for future updates (Mans 2011). In essence the underlying ancillary data must be sufficiently detailed given that the footprint components of the layer are quite smalle / of high spatial resolution.Categories of information
The geospatial data layer contains the following information items:- Tiered depiction of settlements – due to the makeup of the data the different level of aggregation can be used to depict settlements or to represent settlement related statistics.
- Categorisation (typology) of settlements drawn from the most recent research.
- Total Population
- Main economic production per sector, indicated in Rands (SIC1-9)
When referencing the data please use the following:
CSIR. 2021. Settlement-mesozone layer – a geospatial data layer for South Africa. Available at: http://stepsa.org/
For requests or discussions on the dataset please contact:
|
Contact |
Telephone |
|
|
Gerbrand Mans |
(021) 841 2552 |
gmans@csir.co.za |
|
Johan Maritz |
(012) 841 2928 |
jmaritz@csir.co.za |
|
Kathryn Arnold |
(012) 841 3269 |
karnold@csir.co.za |
- Eicher CL & Brewer CA (2001) Dasymetric mapping and areal interpolation: Implementation and evaluation. Cartography and Geographic Information Science 28:125-138.
- Mans GG (2011) Developing a geo-data frame using dasymetric mapping principles to facilitate data integration. AfriGEO Conference: Developing Geomatics for Africa, May - June 2011, Cape Town
[1] Required mesozone size of approximately 49km2.
[2] Part of support to the Green Book project
[3] Due to enumeration purpose these units included a minimum number of people, which is between 100 and 150 households per EA.
[4] If e.g., there are four relevant EAs belonging to the same StatsSA sub-place and two EAs are touching sides with a gap and the other two are touching side, two separate T3 polygons will be created.